This sample chapter from In Zero Trust We Trust focuses on helping you craft standard metrics based on key constructs, such as risk and performance, so that you can showcase the value that Zero Trust brings to the enterprise infrastructure, processes, and people.
Initially, Glenn the consultant had the CIO’s (Mr. Jonathan Smith’s) attention. Now Glenn has Mr. Smith’s curiosity. With more detailed discussions, leadership teams appreciate the value of Zero Trust as a concept; however, they want to know how to apply the concept to their own enterprise. Hence, the logical next step is to map specific business drivers to measurable outcomes that are aligned to the larger Zero Trust vision. Effective metric creation will help enable strategic discussions on identifying Zero Trust mission statements to drive adoption across diverse teams within the organization. A common challenge enterprises face is to convince other leaders (ops, finance, and so on) within the organization that Zero Trust has a larger impact, not only to the security architecture but to overall enterprise risk, strategy, and cost. For example, business operations teams may not see the benefit of adopting Zero Trust unless there is a tangible metric that aligns with their strategy. For a vendor-neutral consultant, it appears obvious to move to a secure access model; however, many intricate dependencies such as cost implications, politics, and overall organization position in the market need to be considered when proposing a metric, as adverse conditions might deter enterprises from implementing Zero Trust. Some of the common deterrents to adoption have been discussed in Chapter 1, “When It All Begins.”
As translators of strategy and operational requirements, if consultants are unable to craft the right metric that is acceptable to leadership, they will not be able to showcase the value that Zero Trust brings to the enterprise infrastructure, processes, and people. Similarly, if the daily operational problems are not considered when crafting metrics, end users and employees will not fully appreciate the value of Zero Trust and its impact to their workflow. It is common knowledge that leadership speaks in the language of performance and risk, and the focus of this chapter will be to help craft metrics based on these key constructs, such as risk and performance. Risk and performance metrics are standard measurements that can be consumed by all business units within the enterprise.
Once leaders and adopters see the value of Zero Trust as a concept for their enterprises, they will be keen to understand from vendors how they incorporate Zero Trust not only into their products but also within the vendor’s enterprise itself. For example, Cisco has been on the Zero Trust journey for quite some time and hence is a good reference point to showcase to other enterprises how they can begin their own journey. Cisco’s journey also helps enterprises understand how to craft customized Zero Trust metrics to validate the efficacy of the Zero Trust initiative.
By driving Zero Trust in the enterprise, you are essentially committing to improve the security posture of the enterprise. Since you are looking at the adoption process of Zero Trust holistically, you must acknowledge that there are very few people who really see the entire Zero Trust picture. The key observants and enablers are leadership stakeholders. Unfortunately, without metrics, the value Zero Trust provides is conjecture at best for most stakeholders. Budgeting is another touchy subject. The board members must buy into your vision, and you must be able to showcase to them that the initiative will bring back quantifiable success in terms of performance improvements or risk reduction and eventually monetary gains and organizational stability. You cannot achieve these broader strategic goals without taking all precautions to protect the data of the customers and employees. At the same time, you do not want to let customers or employees create backdoors due to the extreme lengths the organization goes to secure data. That is where intelligent metrics come in.
There are some common metrics you identify to set a baseline that can be utilized to craft enterprise-specific metrics. Before any discussion about metrics begins, it is important to understand what a good metric is and why it is important to create tangible metrics.
Importance of Measurement
As a consultant, you need to help the enterprise identify a measurable metric. Consider a common example of showing the current status of a movie download in movie download software. It is a common strategy to see status messages on the software user that show “Almost done” rather than “99%” completion. There could be end users comfortable just knowing that the download will finish soon, and there might be other users who want to see the exact download percentage. Another example is the traffic lights showing a countdown to the next light change. Some people consider this a good feature on traffic lights because they prefer to switch off their vehicles when the traffic light is red and turn on the engine seconds before the light turns green. However, the number of such vehicle owners is lesser than the majority population that do not care about the time frame and just keep the engine running. What the architecture and design team must do is run a survey to understand the percentage of each of these users and decide which option to lean toward, which can bring in more utilization and value. Leadership is typically interested in maximizing recurring subscription to services or products along with increase in customer promoters. It is a strategic decision to decide what metric to consider when measuring a specific strategy. A metric like “reduce impact of an attack” is qualitative at best and in reality is very vague and broad scoped. When creating metrics, you must consider that each metric is a means to convince the listener that the scope can be measured and that the strategy is working from each stakeholder’s perspective. Crafting metrics is an adoption strategy by itself and therefore requires the knack of understanding what your target audience wants. To an operations lead, the metrics should resonate with availability and ease of operations. To an enterprise architect, it would resonate with providing the right architecture and design following all best practices and compliance. A CxO would be more concerned with support to the business, recurring revenue, and risk reduction. Hence, Zero Trust shouldn’t be restricted to one type of metric. It is usually an amalgamation of many metrics targeting all the stakeholders.
Another decision is the final state that has been envisioned for the enterprise. Once the metric has been crafted, the enterprise needs to decide where it would like to be from a Zero Trust access perspective, which aligns with their business vision. Should the enterprise target the highest maturity level or should it consider the asset value and context and decide which is the right state to be in. Enterprises need to build a meaningful and achievable metric to be able to show immediate value with tactical and operational returns and, in turn, propose more details about the strategic goals. By possessing some of the characteristics mentioned in subsequent sections, a metric can help an organization to identify, prioritize, and mitigate security risks and maintain a strong security posture to reach the desired performance and alignment to business. This will in turn drive the security budget requirement.
Deciding final state will hence depend on what the enterprise feels critical. A banking enterprise might want to consider any financial activity–related applications as important and applications handling personal identifiable information (PII) data as critical. Data classification, flow mapping, asset inventory, and segmentation will help identify the maturity vision of the enterprise based on the critical infrastructure present and identified. Once the vision is clear, the next step is to build observable, simple metrics to ensure that the capabilities around protecting these critical assets are in place.
The Metrics Lifecycle
The metrics lifecycle is usually part of the overall Zero Trust lifecycle but can still be independently showcased to understand its position and importance in the overall strategy.
There are four key steps in the lifecycle of a metric, as illustrated in Figure 5-1.
)
Figure 5-1 Zero Trust Metrics Lifecycle
The first step is to align any metric to a business driver and, in effect, a security driver. This is a primary reason why metrics are not crafted early on in the discussion with the CIO. One cannot meet a CIO and commit to provide 100% availability and uptime without understanding their business drivers and organizational dynamics. Once the metrics are aligned to the Zero Trust vision and mission, the next step is to craft intelligent metrics that are achievable and quantifiable. In this chapter, the focus is going to be on aligning and crafting metrics. Once metrics are crafted, they need to be presented to the respective stakeholders for approval. This usually happens when the overall strategy is being presented along with the Zero Trust team. Once the Zero Trust initiative has been deployed and metrics are being actively measured, feedback from the implementation and operation teams must be incorporated to the overall metric definition to make the metrics more robust.
Step 1: Align Metrics
Creating metrics must always begin with alignment to the vision and mission. The final goal of metric creation is to measure an activity, process, or capability that can produce an actionable and measurable outcome to support the overall vision or initiatives. Classification of metrics can be varied, depending on whether they are goal-oriented or based on how they are derived.
Types of Metrics Based on Target Goals
The most common taxonomy of metrics includes strategic, operational, and tactical. These are goal-oriented and are crafted based on the type of goal or activity that is being measured.
Strategic Metrics
Strategic metrics are extremely high-level metrics that measure the overall success of an organization in achieving its long-term goals. Strategic metrics typically focus on outcomes, such as revenue growth, market share, or customer satisfaction. They are often used by senior executives and stakeholders to evaluate the performance of the organization as a whole. When overlapped with Zero Trust, strategic metrics measure how well Zero Trust has been adopted in the enterprise and how it has reduced the risk to overall business.
Operational Metrics
Operational metrics measure the day-to-day activities of an organization and the efficiency of its processes. Operational metrics typically focus on inputs, such as the number of sales calls made or the amount of time it takes to complete a task. They are often used by middle managers to monitor performance and identify areas for improvement in day-to-day activities. In a Zero Trust context, an example would be to measure the number of attacks detected in a day or the number of automated incidents handled.
Tactical Metrics
Tactical metrics are used to measure the performance of specific projects or initiatives within an organization. Tactical metrics typically focus on outputs, such as the number of products shipped or the percentage of customers who renew their contracts. They are often used by project managers to track progress of specific organizational initiatives and make adjustments as needed. In a Zero Trust context, an example of a tactical metric would be the measurement of how much infrastructure has been segmented as part of the segmentation initiative, where the extent of segmentation is the initiative being measured.
Strategic metrics measure overall efficacy of the strategy. For example, augmenting existing identity and access management would be a strategic goal. When you speak to a CxO, you need to show revenue growth and business alignment. These are strategic in nature and look far into the future. The alternate aspect of security is “operations,” implying that you are communicating to personnel who handle uptime of infrastructure. Another aspect is building skillset for the management of products, staffing and so on, which can be a major metric for enterprises in locations where there is a dearth of skilled workforce. An operational goal would be reducing the number of incidents by implementing better visibility into the network. Operational metrics will measure how well the enterprise is performing at the grassroots level. This will take into considerations risks that enterprises see every day.
Tactical metrics are somewhere in between strategic and operational metrics. They measure a specific program. For example, a Zero Trust transformation project could be considered a tactical metric to achieve the overall strategic metric of protecting customers’ data. Tactical metrics are focused metrics that most security engineers have not been inherently crafting. A tactical metric would be achieving 99% security awareness for the entire workforce since security awareness itself is an initiative. Attack vectors, threat actors, and many other threat hunting tactics will be deployed to measure the effectiveness of the security initiative.
Types of Metrics Based on Method of Data Analysis
The following classification of metrics is based on how the metrics are calculated and conveyed. There are two major classifications in this type of taxonomy:
Quantitative metrics: Quantitative metrics involve numerical measurements, and they are typically used to measure objective data such as the number of sales, the amount of revenue generated, or the percentage of website visitors who make a purchase. In a Zero Trust context, measurable metrics like failed attacks, reduced risk percentage, and so on are quantitative metrics. Quantitative metrics are often used to track progress toward a specific goal or to make data-driven decisions. These metrics are used for activities that can be measured with numbers, charts, and so on.
Qualitative metrics: Qualitative metrics, on the other hand, are based on subjective assessments and are typically used to measure more intangible factors such as customer satisfaction, brand perception, and employee morale. Qualitative metrics often involve gathering data through methods such as surveys, interviews, and focus groups. These metrics measure over a range of high, medium, or low. The scales can be as granular as needed.
Both qualitative and quantitative metrics are important in data analysis and research, and they often work together to provide a more complete picture of a particular phenomenon—in this case, the overall Zero Trust strategy. While quantitative metrics can provide hard numbers and measurable results, qualitative metrics can offer deeper insights into the reasons behind the data and provide a more nuanced understanding of complex issues.
Be a Translator
As a consultant, you will always find yourselves wearing various hats. Sometimes operations teams need an explanation on how the product or solution works, and on the other hand senior leadership needs another completely different explanation about metrics and strategy. Being a translator is an important aspect of consulting. Metrics are the language that the consultant needs to know as a translator. Once the right metrics are identified, it is important to translate one set of metrics to the other. An operational lead will understand performance metrics, but a translator needs to explain to leadership why a specific strategy is in place and how it drives multiple operational metrics to enhance performance and reduce risk. There must essentially be a translation between a performance metric and a risk metric, as is illustrated in Figure 5-2.
)
Figure 5-2 A Translator in Action
Operational leaders need to build performance metrics, which architects translate as a future state that the enterprise wants to be in. For example, when explaining the need for segmentation in the network, architects will explain the current state of segmentation in the network and showcase how increasing the number of micro-perimeters will help make granular policies and facilitate only need-to-know access, thus boosting productivity. This metric therefore shows a key performance indicator (KPI). Tactical leaders need to know the risk to their assets as well and how the current strategy can reduce or mitigate the risk. When architects translate the same metric to leadership, they explain the current attack surface and then showcase how the segmentation initiative augments the enterprise by protecting it from lateral movement and reducing the blast radius of an attack. These are called key risk indicators (KRIs) and are a list of threats to an enterprise and their mitigations. To recap the same segmentation example, we used the performance indicator of better granular rule creation to boost productivity. This is then translated to a risk indicator, stating that segmentation reduces the blast radius and thus lowers the risk of data loss, which is a strategic metric. A combination of this strategic metric with an operational metric adds context to what the enterprise wants to achieve. The highlight in this case is an effective combination of the key performance metrics (provide only need-to-know access, increase overall security posture) as well as risk metrics and their mitigation (reduce blast radius) to achieve alignment to overall strategic vision.
Being a translator is fascinating because, to be a translator, one not only needs to know multiple languages, but also needs to be able to understand the context of each statement and deliver it with the same emotion and context.
As a translator, you need to get feedback from tactical, strategic, and operational leads and to craft metrics that appeal to all stakeholders. Often metrics are considered as just information or as targets to achieve, where you tick a box on a huge list of security controls. A security audit would list a large set of control gaps and their mitigations, and most enterprises craft metrics based on those gaps. In a Zero Trust context, metrics are not primarily driven by technology or compliance gaps. They are driven by the business and security drivers. Without metrics, it becomes extremely difficult to quantify the effectiveness of a solution or a program. Metrics are key language definitions for leadership and leads alike to gauge how well the Zero Trust initiative is faring. This will effectively influence leaders to provide more support and budget for the tactical Zero Trust mission, which in this case is to provide an accurate access model for your assets.
When you’re considering metrics, the rule of thumb is to keep them simple and achievable. There are metrics that tell you where you want to be and metrics that tell you what your risks are. From the context of creating the right metric, security governance must also be considered to make sure the metrics align with security and the strategy. As a translator, you will not only be translating tactical and operational metrics to senior leadership but also to other non-security-focused business units of the enterprise so that they understand your metrics and build their metrics while keeping their pain points in mind.
Remember the rule of thumb:
Strategic metrics are high level and generally map to measuring the efficacy of a vision or mission statement.
Operational metrics deal with the people and process aspects of enterprise security and help with measuring overall performance and day-to-day activities.
Tactical metrics are specific directional metrics that map to measuring larger initiatives and driving a certain strategic goal. These deal with risks and provide key mitigations controls to be implemented.
All strategic, tactical, and operational metrics can be qualitative, which means they are measured on broader scales and are not supported with numbers. They can also be quantitative, which means they are measured with numbers and graphs.
Step 2: Craft Metrics
Once the vision and mission are established and desired metrics are aligned, it is time to mold the metrics into measurable and convincing outcomes to help garner support from all stakeholders.
Crafting Effective Metrics: A Bicycle Case Study
Metrics are all around us. You measure the efficacy of almost everything in your day-to-day life before investing your money and time. IT infrastructure is no different, and most enterprises have metrics in all business units, as this helps to showcase their effectiveness. This stresses the need to identify what should be measured and how well it needs to be packaged to each stakeholder.
Let’s look at an example of how important metrics are. Consider a high schooler named Gary asking his father for a bicycle and mentioning the following: “My goal is to get a bicycle. I am going to pass all my exams, which should be sufficient incentive for you to buy me one.” To begin with, the first and most critical error on Gary’s part was not having a conversation with his father about what his father wanted. He assumed that passing his exams was sufficient to get his father to buy him a bicycle. This is a common error that many consultants make. They assume what is good for the enterprise without aligning with what the enterprise wants. The next concern is the nature of the metric of “passing” an exam. This might have been unintentional from Gary’s perspective, but in reality, the metric is very open and vague. There is no quantitative information on what score he should receive in each of his exams. Gary did not concern himself with measuring his passing score since he did not confer with his father about the required criteria for buying a bike, which ties in to the first error highlighted.
Let’s dive deeper into some other characteristics. Passing an exam in itself requires valid proof that cannot be refuted. Gary could craft a fake report card or even say he lost the report card and have no tangible way to prove that he passed. The key aspect of a metric is to be able to reliably achieve the same result and measure the success or failure consistently. A report card showcases pass or fail consistently, whereas speaking to other parents or even the teacher may not be as consistent, as they may not have full information on who passed and failed or may be subject to biases. The metric also does not showcase a timeframe, which traces back again to lose alignment with the father. Gary claims he will pass the exam, but when? During which semester? By studying for how much time? These are all critical pieces of information that are missing.
If Gary had spent some time with his father to understand what his father really wants, the metric would be more accurate. For example, “My goal is to be able to ride a bicycle with my friends. For me to achieve this goal, I need a bicycle. I do not have money to buy it, but I know my father does. I spoke to him and he says he can provide me some money if I can prove to him that I am academically fluent (notice the strategic metric). For me to be academically fluent, I need to pass all my exams throughout this year, which covers five subject exams and one elective. I need to pass all four quarters by achieving a grade of 80% or above. My father will save some money as I pass my first two quarters and will buy me the bike once all quarters are complete and all passing criteria have been achieved. If I am unable to achieve my passing score, there is a chance that the money saved by my father might be spent elsewhere, and he might not trust me well enough to revisit or renegotiate my success criteria of 80%.” (Notice the risk metric.)
Two important metrics can be visualized in this long statement. One metric measures the future (achieving 80% or above) and the second metric monitors the present with feedback from past experiences (distribution of bike funds and loss of trust). These are performance and risk metrics, respectively. The metric that Gary now has is much more specific and will be modified depending on his quarter progression, but is a fairly good start to lead to other discussions with his father.
The preceding example should shed some light on the importance of metrics and pave the way to the discussion on crafting the right metrics based on the right business driver. The following are some of the characteristics of a security metric aligned with the Zero Trust mission:
Relevant and aligned: A security metric should be relevant to the organization’s security goals and objectives. It should be able to provide meaningful insights and help the organization make informed decisions to address security risks of not adopting the overall strategy. It must also be aligned with how well the organization wishes to perform to achieve its overall Zero Trust vision. Some examples would be “support the bank to achieve its vision of being a trusted banking partner by protecting the customers’ and employees’ data.”
Measurable: A security metric should be measurable and provide a quantitative or qualitative value that can be compared over time. This helps to track the effectiveness of security measures and identify areas of improvement. An example would be “reduce the number of open showstopper incidents to less than two per year.”
Actionable: A metric should be actionable, meaning that it should provide information that can be used to take specific actions to mitigate or prevent security risks or enhance performance—for example, “provide more information about network traffic to enhance application visibility. This will in turn help SOC operations to make the right decisions either manually or through SOAR automation.”
Additionally, a metric should not, for example, measure success based on something not happening because then it will not lead to an action. For example, consider the metric for the strategic goal “no breaches occur in the network.” This is a fair vision and goal but unfortunately it leads to no action. What happens when there is a breach? How would you measure the risk? A more fruitful metric would be “augment the current segmentation and reduce the blast radius when a breach occurs.” This leads to the action of completing and implementing segmentation, which is a security control that also augments the vision irrespective of whether or not a breach occurs. A metric must enable the vision and strategy of the enterprise.
Reliable: A security metric should be based on reliable data sources and calculations to ensure its accuracy and usefulness in decision-making. For example, measuring the response times of engineers to an incident is a reliable method of measuring the efficacy of the SOC skillset. However, “reduced number of attacks” is not representative of an effective security control. It could be impacted by a lot of factors (like cost, malicious actor deterrence, interest in assets, and so on), which makes the measurement unreliable.
Comprehensive: A security metric should be comprehensive in scope and cover all aspects of the organization’s security posture, including physical, technical, and administrative controls. Zero Trust is not just about implementing technical controls. It must cover administrative, physical, and operational aspects of the processes and people involved in the enterprise. For example, adding biometric authentication at secure server farms can be a metric to fulfil a mission statement of using advanced multifactor authentication solutions to achieve secure data center access.
Understandable: A security metric should be easily understandable by all stakeholders, including technical and non-technical personnel, to ensure effective communication and collaboration in addressing security risks. For example, “secure data at rest” is vague because the specifics of the metric are not available for a technical crowd. “Use AES 256 encryption on all storage devices” is also vague because leadership will not relate to the security mechanisms implemented. They will care about how it helps the business. Hence, a more valid metric would be “secure our customer data by storing only the information we need for the amount of time we need. Encrypt the data in storage to make sure that confidentiality of information is maintained. Use encryption technology with stronger keys like Elliptical Curve Cryptography.”
This is where the initial conversation of being a translator becomes relevant. The metric highlighted here has a non-technical statement that appeals to the leadership and a tail-end technical statement appealing to the operational leads. As translators, architects need to point out the relevant aspect of the metric that each stakeholder cares about.
Timely: A security metric should be timely and provide up-to-date information to ensure timely decision-making and response to security incidents. To make sure we understand this metric clearly, it is important to highlight that it does not relate to building a timeframe for the metric. This metric relates to providing feedback on the measured attribute constantly and creating multiplexed checkpoints to validate what is being measured so that more granular decisions can be made. Let’s take the case study of buying a bicycle. A tactical metric Gary created was to pass his exams with 80% or more to achieve his strategic metric of riding a bike. The father, however, also created an operational metric, which he measures every week by validating the course studied over the week with a weekly quiz that has thirty questions. Gary must pass with 25 correct answers. He must consistently get 25 or above during all the relevant weeks to convince his father that he is studying and on the right direction to achieve his tactical goal of passing his exams.
Ease of metric creation: Finally, one must consider the ease with which the metric can be measured. This has dependency on the maturity stage the enterprise is in as well. For example, an enterprise at “measurable” maturity will have a SOC that is mature and have more visibility options; hence, metrics such as application flow visibility and dynamic context-based access monitoring are still viable. When enterprises are starting out with Zero Trust and are evaluating their existing security controls, metrics like SOC maturity may need more manpower and skill with limited automation. A balance must be maintained between the cost to set up a metric, the long-term benefits, as well as the business alignment. The metric must be easy to craft and implement, and the possibility of measurement must be validated at the crafting stage.
When metric characteristics are considered from an IT infrastructure, they can be visualized as shown in Table 5-1.
Table 5-1 Examples of Various Hybrid Metrics
Hybrid Metrics |
Goal-Based Metrics |
|||
|---|---|---|---|---|
Strategic Metric |
Tactical Metric |
Operational Metric |
||
Metrics based on data collection method |
Qualitative Metric |
Successfully deploy Zero Trust and reach a maturity level of “Quantitatively Managed” as part of CMMI. |
User awareness of Zero Trust movement in the organization. |
Implement multifactor password-less authentication, and measure adoption of strong authentication methods. |
Quantitative Metric |
Number of applications that have been migrate to Zero Trust per month. |
Achieve 100% endpoint compliance as part of larger Zero Trust compliance initiative. |
Reduce mean time to detect (MTTD) to 15 minutes for suspicious endpoints. |
|
The Capability Maturity Model Integration (CMMI) was created by the Software Engineering Institute (SEI) at Carnegie Mellon University. The SEI is a federally funded research and development center that focuses on advancing software engineering and cybersecurity practices. CMMI was developed by a team of researchers and experts at the SEI, and it has since become a widely recognized framework for assessing and improving organizational processes across various domains, including software development, systems engineering, and acquisition.
CMMI has gained widespread adoption in enterprise settings due to its systematic and structured approach to process improvement. It provides organizations with a clear roadmap for enhancing their operational, tactical, or strategic maturity by defining a series of maturity levels, from Initial to Optimizing. This framework fosters a culture of continuous improvement, ensuring that enterprises can adapt to evolving market demands and stay competitive. CMMI’s global applicability and proven success across various industries make it an attractive choice for enterprises seeking to standardize and optimize their processes. Additionally, it often serves as a strategic advantage when bidding for contracts with government agencies or major customers that require demonstrated process maturity, reducing risks, and enhancing the overall quality of products and services.
By offering a common language for discussing and benchmarking processes, CMMI facilitates collaboration within large and diverse organizations. It also helps mitigate risks associated with project delays, budget overruns, and quality issues, resulting in cost savings and improved customer satisfaction. CMMI’s structured methodology, adaptability, and proven track record make it a valuable tool for enterprise maturity, enabling organizations to consistently deliver high-quality products and services while maintaining a competitive edge in today’s dynamic business landscape.
Consider the metrics in Table 5-1 and superimpose the principles that have been listed in the previous sections. When the overall maturity of the Zero Trust implementation is measured, it cannot be mapped to a numerical value. It is achieved after measuring the adoption rate of several initiatives like password-less authentication and user awareness. The overall maturity will be mapped against a broader spectrum inspired from the CMMI maturity model. Hence, this specific metric of Zero Trust deployment becomes a strategic metric measured qualitatively. At the same time, we want to measure how many applications and workloads have been moved to the Zero Trust model. This, however, can be measured and mapped over time, making it a quantitative metric. Migration of workload to a micro-segmented microservices architecture measures how well the Application strategy is being adopted and aligned with the broader Zero Trust Scope.
Consider the tactical metrics and how they align with initiatives, which when combined achieve a strategy or mission. For example, as with the previous metric, user awareness is an important metric when it comes to understanding how well Zero Trust is being accepted in the employee community. These are usually measured with surveys and are still measured as a range of high adoption, medium adoption, or low adoptions. On the contrary, endpoint compliance is an initiative that aligns with the overall Zero Trust deployment mission, and compliance can be measured with a number or percentage of devices that are compliant.
Finally, operational metrics are day-to-day metrics that provide details into specifics of implementation projects. For example, in an ongoing visibility or SOC deployment project, a key metric would be mean time to detect (MTTD) for unknown or suspicious computers. This can be measured in time units and is therefore quantitative. On the other hand, adoption of users authenticating with MFA and password-less methods are qualitative and are broader measurements like high, medium, or low.
Overall, it is imperative to understand that all metrics are tied into each other. A large number of operational metrics measure the efficacy of a specific tactical metric. Multiple tactical metrics will measure the effective adoption of a strategic metric. How the enterprise wishes to measure and showcase the metrics determines if the metrics are qualitative or quantitative. Another disclaimer to highlight here is that certain metrics are ambiguous as to whether they are qualitative or quantitative. Some enterprises might possess the means to measure a specific metric, which other enterprises might not have. Deciding on whether a metric should be qualitative or quantitative is an enterprise-specific decision and cannot be standardized. For example, some enterprises may choose to measure adoption of MFA with number of users as well. There is no wrong metric. There are good metrics and better metrics and they key factor that influences the crafting of these metrics is how it aligns to the enterprise’s requirement.
Measurement Targets for Zero Trust
This section highlights the two main types of metrics: performance and risk metrics.
Performance Metrics
If executive leadership does not understand the risk to business of implementing (or not implementing) a technology, they will not be able to put in the right controls to protect critical assets, and that is almost always the most common reason why enterprises just buy technology to buff up the security initiative but get attacked anyway. An enterprise could have all the security controls, hardware, and endpoint protection in the world and still get attacked if users “approve” instead of “deny” when they get a push message on their MFA solution. There is a common notion that security hinders the business by making access more restrictive and complicated, but the point to remember is, like most mechanisms, security needs to be planned and baked into the solution. The base security strategy must encompass all the business drivers, and security must align with the general business direction. Good security governance goes a long way to promoting the enterprise’s business. Showing key performance improvements by improving security is one of the first steps in measuring Zero Trust success.
A performance metric is a measure used to evaluate how well a particular strategy, process, initiative, or product is performing. It is usually both a quantitative and qualitative indicator that helps in assessing the effectiveness, efficiency, and quality of the measured activity or product. Performance metrics look into the future.
A key aspect of performance metrics are that they are based on the current lack of performance by a specific product or a specific initiative. The feedback on lack of performance may be from senior leadership but is usually from middle managers and operational leads who see day-to-day performance gaps and expect that the Zero Trust initiative will help improve the gaps. The subsections that follow cover some common Zero Trust performance metrics that can be mapped to almost all types of enterprises and are a good starting point to tailor enterprise-specific performance metrics for enterprises.
Adaptability of Security Governance and Business Agility
Organizational needs change over time, and enterprises pivot products and services to suit the general business. Most enterprises do not spend time creating a blueprint or template to fit all security needs of the enterprise. Those who have already got this blueprint do not realize that this blueprint was likely created after the enterprise started its basic functionality and did not take into account any future changes to the business. Unfortunately, security has usually been an afterthought and has never been able to adapt to the changing needs of the business. This has been a concern in the field for most security practitioners defining enterprise security architectures. Zero Trust aims to change that perception. The security vision must be able to adapt to any change in business and support it by making sure the infrastructure and its data gets the right level of protection based on its context. With the right support in place from security, a lot of tasks such as mergers or time to market will be completed much faster. When customers see you take security seriously, you automatically build trust with them, even before they buy your product or service. With a unified architecture framework for security, enterprise business can adapt to any specific organizational change in policies. New types of devices or entities will automatically fall into the right segment and get the appropriate security control.
Security needs to consider different aspects of the business and should not just be reactive. Security must be proactive at protecting the network and making sure incidents are validated, evidence collected, and incident response is being followed to a T. Security must also proactively strategize supporting the existing business and any future changes in the business model. Business must drive technology, not vice versa. A simple example is if an enterprise is selling perfumes and suddenly switches to selling toothbrushes; the overall security vision of protecting the customer’s data should not change.
Adaptability is not quantitative and usually maps to governance and overall vision and mission. This is therefore a strategic qualitative metric. The metric statement would be as follows: “The Zero Trust strategy must allow the security controls implemented to be adaptable to changing business needs.”
Revenue Generation and Cost Savings from Zero Trust Initiatives
In general, a strategy must always align with revenue generation and cost savings, which is the primary focus at any executive level. Without a revenue stake, security will risk being considered an add-on. Zero Trust saves cost for the enterprise by reducing capital expenditure and shifting to operational expenditures. With efficient operations, most processes can get streamlined and optimized fairly quickly in contrast to buying and fitting new hardware, which usually takes months or even years. With the right personnel, accurate information can be extracted from a security device and can be used for multiple purposes like incident response or health monitoring. As you drive a car slower, it becomes easy to control. Similarly, the less complex the business operations are, the easier it is to secure the larger enterprise and the easier it is to identify and isolate key infrastructure.
Along the same lines, automating simpler processes (like incident management, account provisioning, and so on) allows users to allocate their time for more important tasks like incident analysis or even security awareness, which in the long run is a measurable metric in the form of skilled labor. With simpler processes, it becomes easier for various teams to communicate their requirements to each other. Hence, if a specific product is to enter the market with a simpler and transparent development process, it becomes easy to break existing silos and incorporate security from the start.
Another aspect is incorporating metrics to improve the Zero Trust capabilities of a product. Metrics like a Zero Trust index should be allocated for a product to measure the extent to which the product can support a Zero Trust strategy. This would include capabilities like context-based policing, visibility capability and so on.
Revenue is almost never a qualitative metric. Revenue generation is a business requirement. The metric statement will read, “The annual target revenue to be generated by implementing the Zero Trust initiatives is $10 million or above.” Another metric would read, “The measured Zero Trust index for products sold by the enterprise must be more than seven measured on a scale of one to ten.” Observe that one metric is a metric for the enterprise itself and how implementing the Zero Trust initiative saves cost, the second metric is relating to creating products that support customers and generate revenue. Both aspects align with business bringing in more profit margins. The metric stays strategic but is quantitative in nature.
Technology Innovation and Improvements
Security must support any disrupting technology that changes the direction of the business. It must adapt to changing security control and provide a better control strategy for any business models. Any technology innovation must be easily absorbed by the security and access control strategy.
Do not be scared of innovation. Necessity is the mother of invention, and that is exactly why we shouldn’t be breaking that cycle. Many enterprise departments consider innovation as a hindrance to the business and are very wary to take a risk, especially with security. Blocking innovation is almost always detrimental to business. The perceived risk is never worth the returns that innovation could bring, and this is what determines how effective a leadership board is. They need to be able to identify a good innovative initiative and support it with clear understanding (and a measurable metric) of how it will bring back revenue and support the business. Supporting security innovations is an effective way of baking in security rather than bolting it on later, as modern designs and technology mandate that security be considered in all early discussions.
Microservices, for example, greatly support implementation of Zero Trust. Microservices comprise a services-oriented architectural approach to designing applications. It involves breaking down large, monolithic software applications into smaller, independently deployable services, preferably as ephemeral instances that can be redeployed in a matter of minutes. Containers are typically an example of microservices implementation, where web, application, and database services reside on separate container instances. This is not a concept that can be implemented by an enterprise in a day and needs well-planned application migration or transformation strategies. These microservices communicate via APIs and can be developed, deployed, and scaled independently. Microservices, with their fine-grained control over access and communication, can play a pivotal role in implementing Zero Trust security by facilitating granular access controls and security policies. Addition of the API-based information exchange helps Zero Trust architects to craft micro-segmentation around these flows. Each microservice can be treated as an independent entity with its own security rules, ensuring that only authorized entities can access specific services or data. Additionally, microservices can provide detailed logs and telemetry data, making it easier to monitor and detect suspicious activity, which is another fundamental aspect of Zero Trust.
It is important to clarify that implementing microservices does not mean Zero Trust is in place. You could have all the segmentation in the world, and if you allow all services to talk to each other, you are essentially following the implicit trust model.
Consider that you are buying a product that allows an administrator to escalate to root to perform troubleshooting capabilities. This product comes “as is” from the vendor, and you cannot really disable the root access provided. If this device is compromised, it could essentially give full access to your network. You need the product to facilitate your business, but you do not see it at the right security level. In a traditional model, one would consider the product as a larger risk, even though it greatly augments business. With Zero Trust, as long as you can control device access to a restricted set of people with specific roles and attributes, the blast radius of compromise is restricted to a specific user segment. Isolation from other network devices via VLANs and VRFs also helps provide network segmentation. Only device administrators can access the device over management, and the device can communicate only to specific systems that need to consume its information. By selectively providing access and making sure only the right servers and subjects can access this product, you have reduced the blast radius, increased security posture, and still allowed the business to continue. Over time, the vulnerability can be patched, but this does not need to hamper the business.
Technology supports initiatives, and support of innovative technology is a tactical performance indicator for the enterprise. The metric statement will read as follows: “Adopt innovative technology into all enterprise-driven initiatives.” Each initiative would get a detailed metric statement; for example, “Adopt innovative inspection methods when monitoring encrypted traffic.” This is tactical because it is supporting a specific initiative and is quantitative because we are measuring the adoption as a percentage of traffic inspected (90% of traffic inspected with Encrypted Traffic Analysis).
Efficacy of Customer Experience
Security controls must augment and support the business, user, or customer experience. If you are a security vendor, your products must not hamper business but must support and improve the way users access the devices and implement security policy. Operational support from the vendor as well as services rendered to support the product constitute customer experience, and from a Zero Trust maturity perspective, restrictive policies must not hinder business as usual (BAU). All policy creation must be backed and substantiated by continuously updated asset management, flow analysis, and segmentation.
Customer experience front desk agents are an example of how Zero Trust can help build trust with customers. Front desk agents now have access to more data than was previously considered relevant. In all practicality, they potentially have access to sensitive information as well to make the customer experience more customized. In a traditional setup, the agents would not be provided access to sensitive data and their communication to customers would be fairly dull and routine. With Zero Trust and secure API access, customer experience agents can be given just enough access to data so that the experience with each customer is unique. This will increase customer retention with a more effective subscription model.
When viewed from a different lens, security can be proactive or reactive. Generally, security is perceived as a reactive control. Risk analysis considers the threats to a specific asset, the possible attacks that could have occurred and provides recommendations for the controls to be implemented. This, however, measures success based on not being attacked. Zero Trust, on the other hand, assumes a breach and measures success based on how well you restrict that breach from exfiltrating your critical infrastructure. This way, you need to make sure you identify critical infrastructure and protect it well with the right access control, thus augmenting business and user experience. The likelihood of a threat might be extremely low, yet if the impact of a breach is high, the right controls and protection must be implemented.
Another example is migration of applications to the cloud. The cloud allows you to make minor changes and still move applications in a lift-and-shift model; however, when you consider the cloud, enterprise boundaries are not the same, the actors are not the same, and under no circumstance are the networks the same. Then how would an enterprise design its on-premises security around a completely different infrastructure? The simpler approach would be to rearchitect the security model and fit the cloud access model. Hence, a strategic quantitative metric here will be “support the customers and improve customer experience by reducing the downtime caused by enterprise migrations. The maximum tolerable downtime for a migration is 1 hour.” This should be backed by the following tactical metric: “Adapt all workload to a multicloud architecture seamlessly with least impact to customer applications and least need for modifications. Achieve workload agility across various platforms and networks.” This is measured with the number of workloads migrated (quantitative) and customer satisfaction (qualitative).
Evaluating the Preparedness of the Enterprise
The Information Technology Infrastructure Library (ITIL) service catalog plays a valuable role in the operation and management of the overall Zero Trust security strategy, architecture, and implementation. It also helps build a framework for measuring how ready the enterprise is to manage and improve on the Zero Trust solution.
The ITIL service catalog is a centralized repository that contains detailed information about the IT services offered by an organization. It provides a structured and standardized view of available services, including their descriptions, service levels, dependencies, and associated costs. In the context of Zero Trust, the service catalog serves as a critical tool for defining and managing various services. Critical services include the following:
Policy Management services (including access controls and permissions for various IT services and resources)
Logging and event correlation services
Incident response services
Security Operations Center Analyst services
Identity and Access Management services (user identity lifecycle management)
Data Management services (data lifecycle management)
System and application management services (application lifecycle management)
Digital Risk Management services
Compliance Management services
The service catalog can facilitate access request and approval workflows. When users need access to specific resources or services, they can use the catalog to request access. These requests can trigger approval processes, ensuring that access is granted only to authorized individuals. This allows an enterprise to embark on the automation path with the right service definition and outcome.
ITIL also emphasizes the service lifecycle, which includes stages like service design, transition, operation, and continual service improvement. To showcase the level of preparedness as a performance indicator, you need to define what preparedness means for your organization. Depending on your industry and business operations, preparedness can have different meanings. For example, preparedness could mean being ready to respond to a crisis or an incident, having the necessary resources to meet customer demand, or having robust cybersecurity measures in place. You will need to craft metrics on how to measure the readiness of critical services needed to make sure the Zero Trust architecture and its necessary services is being implemented according to the original business vision and mission. You need to establish measurable objectives, which involves identifying the specific outcomes that will indicate the level of preparedness. For instance, if preparedness means having the resources to meet customer demand, you could set objectives around inventory levels, delivery times, and customer satisfaction rates. Some other examples are business continuity plans (BCPs), supply chain management, and crisis management. Once measurable objectives are created, you need to determine the specific targets that are to be achieved to demonstrate the desired level of preparedness based on the identified outcomes. These targets should be achievable, realistic, and aligned with your overall business strategy.
An example of a metric statement would be, “Measure the current zero trust maturity, identify key initiatives to invest in, and measure how well they have been integrated and adopted.” Adoption of initiatives is a tactical qualitative metric. Note that enterprise preparedness is different from business agility. Business agility is strategic, and enterprise preparedness is tactical and maps to multiple technical and service initiatives.
Protection from Unauthorized Access Attempts
An important performance metric relating to access control is protection from unauthorized external access. This aims to measure how well the enterprise prevents external agents from attacking or entering their environment. Consider this as an operational task by any SOC in the enterprise. As an operational metric, it measures how well an enterprise can block out external attacks. This can be measured as a percentage of blocks determined by the number of blocks across a number of attempts over a timeframe. This make is a quantitative operational metric. Considering that Zero Trust is identity-centric, another important metric is to validate how many failed authentications are seen in the network. For some time during the learning phase, the failed authentication may increase but then overall the number of failed authentications must decrease from the current value showcasing the effective implementation of user authentication with MFA. This is also an operational quantitative metric, and the statement will be “percentage of unauthorized access attempts blocked must not be lesser than 98%.”
Efficacy of Network and Endpoint Visibility
This metric is a measure of how well the enterprise monitors for network- and endpoint-based incidents and events. It also includes similar metrics like the following:
Percentage visibility of managed and unmanaged devices
Number of security incidents it has recorded successfully
Number of incidents remediated
Incidents identified and recorded fast (lower mean time to detection)
Incidents mitigated fast (lower mean time to resolution).
Incident response capabilities are quantitative performance metrics, especially metrics like time to contain an incident (mean time to contain) and mean time to resolve an incident (mean time to resolution). These metrics could be qualitative or quantitative but are usually operationally motivated and hence considered measurable and quantitative. For example, a metric statement will read, “Mean time to incident resolution must not be more than one day.”
Effective and Optimized Policy Creation
An enterprise should already have started mapping assets and flows or at least put asset inventory into its road map. After a certain stage of asset and flow mapping, the enterprise will be mature enough to perform trust modeling. Context of trust here is not just limited to flows but also to general security and governance policy. A business unit might have a different risk appetite in response to a certain threat. For example, an incident response team might consider failed authentications as a larger threat, but the HR department might not see it as a threat but rather as an operational concern. The trust factor and the promise to protect customer data in both cases should be the same, not only for the two business units but also enterprise-wide. Therefore, protecting all forms of customer data handled by various business units must also be considered. Trust conversations and modeling are key, as are risk conversations.
There are both operational and tactical metrics in this aspect of performance measurement. An operational qualitative metric will read, “Reduce the complexity of the rule creation by making rules contextual in nature, thus making operations simpler.” This metric can be measured as Easy, Medium, or Hard. A tactical qualitative metric, however, would read, “Move the enterprise to create context-based rules to improve the effectiveness of the rules and make them more operationally simple and contextually relevant.” This measures the effectiveness of the rule base from most simple and effective to complex and ineffective and relates to an enterprise-wide initiative of creating context-based policies.
Risk Metrics
The second type of metric measures the risk of threats exploiting vulnerabilities in the enterprise. With dynamic software-defined perimeters and a changing threat landscape, perimeter-based security is being perceived as less effective. With the right social engineering tactics, a malicious entity doesn’t need to traverse your Internet and DMZ zone but could potentially be placed right into the heart of the enterprise’s server farm without having to bat an eye. As senior leadership, how would one judge the controls needed without knowing the true nature of the asset and the risk to that asset? Once the context of an asset is understood, one will realize that placing an asset within a fixed boundary is moot.
Risk metrics also showcase a different picture to leadership. Rather than focusing on the future with performance and cost, risk metrics showcase the current risk profile and measure how the enterprise can reduce the risk to a more acceptable state. This includes reducing blast radius, assuming a breach, decreasing overall risk exposure and so on. Continuing with the front desk operator example discussed earlier, a front desk operator handles communication to customers and doesn’t need to have access to server farm servers or other DMZ segments. As part of their communication, they must access their application, which in turn needs to extract customer PII or critical information from the server application via an API. If this situation is observed in more detail, the safe moat for the information is gone, and you have created a zipline from the untrusted segments to the trusted server farm, which completely depends on the security awareness of the front desk operator. The point being made is that data flow is no longer in a definite direction. It flows everywhere, and depending on how important the information or asset is, the risk is higher. If it is handled at different parts of the network, it must be protected with the same context. PII needs to be secured at the edge as well as in the server farm. Enterprises deploy defense-in-depth concepts by deploying security controls from various vendors; however, if there is a need for uniform policy, the security capabilities must match for all vendors. If a Cisco firewall detects Facebook chat but a Check Point firewall does not, uniform policy is lost. Now the server application itself might need to provide API access to public cloud applications, and you’ve basically allowed an enterprise-owned asset in an IaaS to access your application on your premises without the right security control. Boundaries are changing and perimeters are no longer static. Defense in depth is no longer as effective as it has been many years ago, and measuring the risk is an important aspect of creating metrics because our final goal is to lower the risk. Remember, risk cannot be entirely eliminated.
Another viewpoint is at the CxO level, where the risk to an enterprise is large scale and less technical. Risk at that level needs to show quantifiable outcomes and still cover a larger scale like vulnerable devices, risk to reputation, and risk of revenue loss. Solutions like RiskLens or Cisco Kenna provide a much needed alignment of enterprise-specific risk metrics to industry-standard solutions to make sure that the risk appetite is quantified and clearly measured for an organization. Maintaining risk metrics is not only optimal but also critical to measure the exact security posture of an enterprise.
Protection of assets must be focused and security controls must be closer to the asset. This is what drives risk discussions. Access to our resources is no longer restricted to specific defined subjects. A server is not just managed by a server administrator. Subjects from cloud networks, virtual machine admins, and so on need access to various aspects of the network, and a compromise of any of these accounts can compromise the entire network without the right access model. Service accounts facilitate services to log in and begin communication across the network without the intervention of a human user, which makes these accounts common targets for account compromise and privilege escalation. This is especially true if workload is on the cloud. The best example to explain the risk of cloud workload is that of a house. The premise of the cloud is to basically be ubiquitous and accessible to everyone. That’s like building a house and telling everyone that they can access it, which of course is not true. In reality, your house is already in the public domain, and everyone who is motivated can find your house but they cannot enter it. That is exactly what Zero Trust architectures help enterprises achieve. Controlling access based on context and risk profile is the final goal.
Most risks are measured quantitatively, and this comes directly based on certain common aspects like impact, vulnerability, annual loss expectancy, and so on; however, there are risks measured qualitatively as well such as threat event frequency and the like. Generally, when qualitative analysis is considered, multiple dependent teams need to get involved.
Applications, processes, systems, and network users are all assets that bring with them their own inherent risks. For enterprises to be able to perform qualitative analysis, risk must always be considered. In Zero Trust, risk analysis is even stricter because it needs to assume a breach has happened rather than the impact when a breach happens. Risk analysis must be performed for all the assets, along with threat models to make sure that the right risks are prioritized and the right metric can be crafted and achieved. The sections that follow describe some common risk metrics.
Asset-Focused Risk Management
An asset-focused risk management approach places the asset at the core and attempts to understand the risk of loss. The quantitative metrics that can be used to identify the impact of loss per year are as follows:
Asset value (AV) represents the estimated monetary value of the asset that is at risk. This could include assets like data, intellectual property, equipment, and other tangible or intangible assets. People are considered assets as well. AV is measured in currency to represent monetary value.
Exposure factor (EF) is the percentage of the asset’s value that is expected to be lost in the event of a successful attack from an external threat. It is usually measured as a percentage of the total asset value.
Single loss expectancy (SLE) is a term used in risk management to describe the expected financial loss from a single security incident or event. It is a metric that helps organizations to quantify the potential impact of a security breach, which in turn can help them to prioritize their security efforts.
The SLE is calculated by multiplying the asset value (AV) by the exposure factor (EF):
SLE = AV × EF
Essentially, if you have $10 worth of candy and the chance that your brother will take it is high, and if he does, he’ll take three quarters of your candy, your SLE is 75% of $10, which is $7.50.
Annualized rate of occurrence (ARO) represents the estimated frequency at which the particular security incident or event is expected to occur within a year.
Annual loss expectancy (ALE) is a term used in risk management to describe the expected financial loss per year from a particular security incident or event. It is a metric that helps organizations to quantify the potential impact of a security breach on an annual basis.
The annual loss expectancy is calculated by multiplying the single loss expectancy (SLE) by the annualized rate of occurrence (ARO).
ALE = SLE × ARO
Following the previous example, if your brother takes 75% of your candy every day, then in a year your annual loss expectancy is 0.75×10×365, which is $2,737.50.
An annual loss expectancy is a clear indication of the impact of loss. For example, if your PII is exfiltrated, the impact loss is $1M. This provides a very useful metric to leadership on how important an asset is and to prioritize security controls for the asset.
Context-Based Risk Management: Open FAIR Risk Analysis
The second less-utilized but more relevant option is context-based risk management and its derivative metric. Here, the focus is not only on the asset but its entire environment, including its threats. The center shifts to how much of a threat is a specific activity and is not just restricted to external threats. Context-based metrics are risk indicators or measurements that are tailored to a specific situation or context. These metrics take into account the unique characteristics of the situation, such as the goals of the organization, the industry, the market, or the audience. These are important because they provide more relevant and accurate information than generic metrics that apply to all situations. By focusing on the specific context, organizations can better evaluate their performance and make more informed decisions. Solutions like RiskLens utilize a methodology to consider the entire enterprise as the scope and provide a clear measurable risk. This allows the enterprise to evaluate its own risk appetite in alignment with industry-standard solutions.
A well-known contextual risk analysis framework is Open FAIR, which is a method of risk analysis well aligned with the Zero Trust narrative because Open FAIR looks at a failure use case rather than an asset specifically. It looks at threats and impact after a breach to validate specific metrics, which aligns with the overall context of the asset and data flow rather than just the asset. It is similar to the asset-focused risk analysis, except for the scope of the metrics, which covers more context. Open FAIR was built on the basis of the original FAIR method of analysis created in 2007. Over time, with collaboration with the Open Group, the Open FAIR Risk Analysis method was created in 2009.1
Note that asset-focused risk metrics focus only on the impact of loss of an asset. Context-based metrics focus not only on impact of the loss but on impact of loss under various conditions when exposed to different threats. Having multiple threats leads to multiple loss impacts. Loss of PII in general has a dollar value attached to it, but loss of PII to a belligerent country is worse and has catastrophic repercussions. Impact of loss is not only to tangible assets but also to abstract assets such as reputation of the company. Thus, context-based metrics showcase the entire end-to-end impact of the loss.
To understand why Open FAIR is relevant to the Zero Trust conversation and to understand how different the methodology is from asset-based risk analysis, the following section will cover the overall phases of the Open FAIR risk analysis. There are five major phases of Open FAIR risk analysis. In this section, a baseline of some of these metrics will be created, which will subsequently be utilized in the interview with the CIO, CISO, COO, and CTO. Figure 5-3 illustrates the five phases of the Open FAIR methodology.
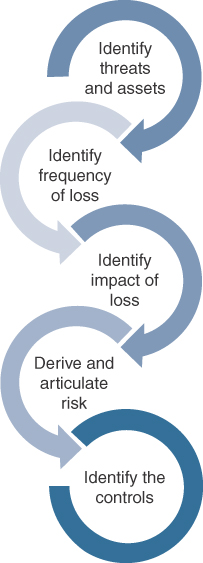
Figure 5-3 The Open FAIR Methodology
Phase 1: Identify the Threat and Asset
Similar to Exposure factor, which is derived from threats, the first phase of Open FAIR is to identify a Loss scenario, which is derived when an asset is compromised by a threat by exploiting a vulnerability, which leads to an incident and subsequent loss of money or reputation under specific conditions. These are key distinguishing factors when assigning a loss value and are not as straightforward as assigning a simple dollar value to an asset. In this case, we are looking at a loss scenario and not the loss value based on intrinsic asset value. Essentially this is an entire kill chain, starting with identifying the target and going to the means of attack. The Cyber Kill Chain is a concept developed by Lockheed Martin that describes the stages of a cyberattack. It is intended to provide a framework for understanding and defending against sophisticated cyberattacks.
The Cyber Kill Chain consists of the following stages:
Reconnaissance: The attacker collects information about the target system and its vulnerabilities.
Weaponization: The attacker creates a weapon, such as a virus or a Trojan horse, that can be used to exploit a vulnerability in the target system.
Delivery: The attacker delivers the weapon to the target system, often through phishing emails or other social engineering tactics.
Exploitation: The weapon is used to exploit the vulnerability in the target system, allowing the attacker to gain access to sensitive data or take control of the system.
Installation: The attacker installs malware or other tools on the compromised system to maintain access and control.
Command and control: The attacker establishes a command and control (C2) channel to communicate with the compromised system and issue commands.
Actions on objectives: The attacker carries out their intended actions, which may include stealing data, disrupting operations, or causing damage to the system.
If we consider the kill chain, we are looking holistically at a loss scenario, which is a useful metric to explain to leadership because it will drive the need for Zero Trust better. This also aligns with context-based policies, which help propagate uniform policies across the enterprise. Remember that nothing drives initiatives better than the fear of an attack. When leadership sees how easy it is to extract data and how well the strategy can be measured, they will be more open to accept the strategy and provide funds for implementation. A Zero Trust strategy presentation usually has a relevant kill chain scenario to showcase how Zero Trust reduces some of the risk.
Phase 2: Identify Frequency of a Loss
In this phase, the overall frequency of a specific loss event is calculated, which is called loss event frequency. This metric is analogous to the annual rate of occurrence (ARO). There are certain metrics that help identify the loss event frequency for each loss event.
Threat Event Frequency
Threat event frequency refers to the rate at which a particular type of threat occurs within a given time period. For example, floods in Singapore happen once in 25 years. It is often used as a metric for assessing the likelihood or probability of a threat occurring and is a key component of risk management.
Threat event frequency can be measured in different ways, depending on the specific threat being assessed and the available data. For example, it might be measured as the number of attempted cyberattacks per day, the number of incidents of employee theft per year, or the number of natural disasters per decade. To quantify this in more detail, it is measured by calculating the contact frequency, which is the probability that a threat agent will come in contact with an asset in a given timeframe (an example would be the number of times an external agent fails to authenticate to the network) as well as the probability of action, which basically measures what the chances are that the threat will take an action when in contact with an asset in a given timeframe (the probability of action on a DMZ web server is far more than the probability of action on an internal router).
To calculate threat event frequency, data is typically collected and analyzed over a specific time period to determine the number of instances in which the threat occurred. This data can be used to develop statistical models to predict the likelihood of future occurrences. Note that frequency of loss is usually qualitative. Table 5-2 showcases the threat event frequency for a scenario of customer data being exfiltrated to a malicious entity. The quantity of 50 times and time frame of 5 years in Table 5-2 will be unique for each enterprise and must be statistically derived with relevant enterprise threat research.
Table 5-2 Threat Event Frequency Rating
Rating |
Frequency of the event of occurring |
|---|---|
VERY HIGH |
Greater than 50 times a year |
HIGH |
10 times a year to 50 times a year |
MODERATE |
Once a year to 10 times a year |
LOW |
Once in 5 years to once a year (ARO = 1) |
VERY LOW |
Less than once in 5 years (0.2) |
Threat Capability
Threat capability refers to the overall capability of a threat to take an action. It impacts the probability of action when evaluating threat event frequency because when the capability of a threat is large, the chances of it taking an action when in contact with an asset is higher. A DDoS attack is a threat. The capability of state-sponsored actors executing a DDoS attack is high because they have infinite money and time and a fixed target set (which is identified in frequency of loss). If a state-sponsored actor comes in contact with customer data, the probability of action is very high and the threat capability is very high, which means the risk is much higher than just measuring annual loss expectancy. Table 5-3 showcases an example of measuring the threat capability of a malicious actor to exfiltrate customer data. This is based on multiple factors such as motivation, technical skills, and availability of time and money. Threat capability is also measured qualitatively. The number 2% and 15% in Table 5-3 will be unique for each enterprise and must be statistically derived with relevant enterprise threat research.
Table 5-3 Threat Capability of an External Actor
Rating |
Capability scale |
|---|---|
VERY HIGH |
Top 2% |
HIGH |
Top 15% of attackers |
MODERATE |
Average between 15% and 85% |
LOW |
Last 15% |
VERY LOW |
Last 2% |
Control Strength or Resistance Strength
Control strength is the capability of a security control to resist the strength that a threat can apply on an asset. If segmentation as a control can be used to prevent a state-sponsored actor from accessing customer data, control strength measures how effective segmentation is and would be HIGH or VERY HIGH. In turn, it could reduce the loss frequency from VERY HIGH to MEDIUM based on its strength. Control strength also ties in with the threat capability of an actor. For example, effectiveness of a control’s strength is much higher if it can deter threats with VERY HIGH capability. Overall, the control strength is also a qualitative metric that measures how effective it is to implement a control. Table 5-4, for example, showcases a rating system for control strength. The number 2% and 15% in Table 5-4 will be unique for each enterprise and must be statistically derived with relevant enterprise threat research.
Table 5-4 Control Strength Capability Rating
Rating |
Capability scale |
|---|---|
VERY HIGH |
Protect against top 2% threat actors |
HIGH |
Protect against top 15% threat actors |
MODERATE |
Protect against average threat actors |
LOW |
Protect only against lower 15% threat actors |
VERY LOW |
Protect against lower 2% threat actors |
Calculate Vulnerability
Vulnerability is the probability that a threat event will materialize into a loss event. This also means that the strength of the threat is greater than the controls in place. Your customer data is vulnerable to attack if segmentation doesn’t deter or prevent a state-sponsored attacker from exfiltrating data. Remember, a vulnerability is always created when the threat capability is greater than existing controls. In simple terms, if the existing controls are VERY LOW and the threat capability is VERY HIGH, then the vulnerability is also VERY HIGH. The larger the control gap, the larger the vulnerability. Table 5-5 can be used as a mapping between threat capability and control strength. As is clear, even with strong control strength, the higher the capability of the threat, the higher the chance a vulnerability will be exploited.
Table 5-5 Vulnerability Derivation
)
Loss Event Frequency
The Loss Event frequency is the number of times a threat can impact an asset and lead to a potential loss within a specific timeframe. In context of specific threats mentioned before, the number of attack attempts doesn’t showcase the loss event frequency because a loss has not occurred. The number of successful data exfiltration attempts maps to loss event frequency. The number of times a vulnerability is exploited within a specific timeframe is the key metric. If the vulnerability is VERY HIGH and the threat event frequency is VERY HIGH, the resulting loss event frequency is going to be VERY HIGH. A VERY HIGH loss event frequency signifies that a breach is almost certain to occur and steps must be taken to mitigate the threat. Table 5-6 showcases a loss even frequency derivation.
Table 5-6 Loss Event Frequency Derivation
)
Phase 3: Impact of Loss
The impact of loss is a measure used by enterprises to identify and evaluate the various environmental factors that can contribute to a loss of asset when there is a breach. The following constructs are critical to understanding the measurement and how the impact is evaluated.
Evaluate Probable Loss Magnitude (PLM)
Probable loss magnitude (PLM) is the probable loss that a loss event can incur for the enterprise. Since this is a probable loss, it need not be quantitative in nature and can be qualitative. For example, loss of customer data can lead to high loss of reputation.
Estimate Worst-Case Loss
The worst-case loss refers to the estimated maximum possible loss that an individual or organization can incur from a particular investment or decision. In other words, it represents the estimated largest amount of money that can be lost under the most unfavorable conditions or scenarios. This is the loss for the worst-case scenario. For example, if an investor is considering investing in a particular stock, the worst-case loss would be the maximum amount they could lose if the stock price were to plummet to zero. Similarly, if a business is considering a new project, the worst-case loss would be the largest possible financial loss they could incur if the project were to fail completely.
Estimate Probable Loss
Probable loss refers to a potential financial loss that is likely to occur in the future based on past experience, trends, or other available data. It represents the estimated amount of money that an individual or organization may lose as a result of a specific event or risk materializing. This is a more realistic value and what most enterprises will be prepared for.
For example, an insurance company may estimate the probable loss associated with a particular type of insurance policy by analyzing historical data on claims and losses. Similarly, a business might estimate the probable loss associated with a new project by analyzing market trends, competition, and other relevant factors. When and enterprise is considering measurement of probable loss, the dollar value associated with each qualitative range is based on the general impact of the loss in the specific enterprise stream. Loss of PII is a large impact for all verticals in the market, but loss of availability impacts banks more than a research institute. Table 5-7 showcases a possible magnitude range and the associated dollar values.
Table 5-7 Magnitude of Impact: A Qualitative Mapping
Magnitude of Impact |
Range in $ |
|---|---|
SEVERE |
Greater than 10 million |
HIGH |
1 million to 10 million |
MODERATE |
100K to 1 million |
LOW |
10K to 100K |
VERY LOW |
Less than 10K |
It is important to note that the magnitude of impact can be dependent on various external factors and not just monetary. Reputation loss, losing competitive edge, fines and compliance issues, loss of operations, loss of customer data, and so on are some other dimensions of how magnitude of impact is calculated. Enterprises ideally must use more than just one of these aspects to determine magnitude of impact.
Phase 4: Derive and Articulate Risk
In this phase you map all the findings and qualitative ratings to the actual risk of a threat scenario or risk of not addressing a specific security gap. The story of the risk metric must begin from the threat and asset loss use case followed by the strength of the threat and how frequently the threat will materialize. Then, based on existing controls, the impact of loss is derived. Finally, the frequency of the loss event is mapped to the impact of loss using the probable loss magnitude (PLM) to derive the contextual risk. Table 5-8 illustrates mapping the risk, and Table 5-9 illustrates the risk calculation.
Table 5-8 Risk Severity Key
Risk Key |
Description |
|---|---|
Critical |
Catastrophic risk to overall IT infrastructure and enterprise reputation. Large-scale impact due to vulnerability being exploited. |
High |
Huge impact to overall business. Might lead to downtimes and there is high chance that there will be loss of data. |
Medium |
Impact to business as usual. Several processes may be halted. Chance that a vulnerability is exploited is not large. |
Low |
Very low chance that a vulnerability is exploited. |
Table 5-9 Risk Derivation
)
)
Phase 5: Identify the Controls
The final phase of any risk analysis framework is to have a tangible outcome to the risk derivation. In this case, it involves identifying the right security controls for the identified risks. The control, however, is not asset focused. It is not a response to a gap in asset protection. The controls identified are based on real threats and contextual environmental responses. It adds more contextual value to the controls identified. In this way, Open FAIR sets itself apart from most risk analysis frameworks and is fully aligned with the Zero Trust paradigm.
Step 3: Present the Metrics
After crafting metrics and making sure there are clear objectives and targets to measure, the next step in the metrics lifecycle involves accurate representation of metrics in the overall Zero Trust strategy and architecture presentation to all the relevant stakeholders. A more detailed representation of this phase is covered in Chapter 10, “Presenting the Zero Trust Strategy.”
Step 4: Monitor Metrics
The final step in the metrics lifecycle is to implement the crafted metrics. In this phase customized metrics are deployed and implemented along with the overall Zero Trust architecture. Once in production, the metrics are monitored and then any changes, feedback, or improvements are incorporated into the overall metrics design and subsequently into the Zero Trust architecture. Details of implementation and monitoring are covered in Chapter 11, “Implementation and Continuous Monitoring.”
A Hybrid Approach
Usually, most enterprises do not pick and choose a specific risk management approach since asset-based risk management and threat-based risk management both have their pros and cons. The asset-based risk management is a more traditional method of risk management, and crafting metrics from these methods would need a strong asset inventory setup. This is usually a long process and has multiple recurring cycles to enrich. Depending on asset inventory alone would greatly impact the crafting of metrics and its timelines. Threat-based risk management is faster and more effective when it comes to context-based evaluations. An enterprise would usually begin asset inventory and start identifying key assets. As each asset is identified, threat flow scenario–based risk management is performed, and over time the metric gets crafted or influenced by the threat flows identified for each type of asset. At this stage, during strategic and architectural discussions, the main goal is to spend time and effort to align and craft critical metrics that satisfy and resonate with all stakeholders.
The Follow-Up
[Glenn pauses and ends with a quick summary.]
Glenn: In summary, here are some highlights of what we want to achieve:
Metrics are important to be able to drive adoption of the Zero Trust vision to senior leadership.
The metric lifecycle consists of aligning metrics to business, crafting intelligent metrics, presenting the metrics to all stakeholders, and monitoring the metrics to make them more robust and relevant.
In this discussion, we spent time only on aligning and crafting. We will present the metrics with the overall strategy and modify metrics if needed once they are deployed and monitored. This will happen post-implementation of the architecture.
Alignment of metrics can be the following:
Goal based
Strategic
Tactical
Operational
Measurement based
Qualitative
Quantitative
Metrics are crafted as either performance metrics or risk metrics.
Performance metrics are future-looking; risk metrics measure the current state and gaps.
Risk metrics can be asset focused or context focused. Our goal is to be able to showcase context-focused metrics because they consider the overall asset and threat and not just the intrinsic asset value.
Mr. Smith: Alright. Metrics are not new to me; however, it has always been a hassle to align the metrics with our security initiatives. I want you to spend some time with Mariam, Jed, and William and craft the relevant metrics for us relevant to the Zero Trust initiative.
Glenn: Yes, I have, and before I begin, I would like to start by doing a recap to make sure we have correctly understood your vision and mission. In short, the following graphic represents the vision and mission of Zenith Trust Bank (see Figure 5-4).
)
Figure 5-4 Zenith Trust Bank Vision and Mission
With the vision and mission in mind, let us start with what we want to measure to take the Zero Trust strategy forward.
Strategic Performance Metrics
Ease of access of user data measured qualitatively. This metric relates to how easily data owners can access their data. Data owners usually include end-users like customers as well as employees, and the measurement is based on factors like availability from anywhere, strong authentication, and so on. A questionnaire will be sent to a sample of groups to understand the overall ease of access.
High: A scope of High means that the data is accessible easily.
Medium: A Medium scope points to possible issues with access or delays in access.
Low: A scope of Low means difficult availability or possibly unavailability of data when needed due to restrictive security measures.
This metric aligns with the mission statement “Provide convenient and easy data access for customers and employees.”
Strength of controls for critical data measured qualitatively. This metric relates to control strength for critical data. This measures the security controls that have been considered when subjects access the data. This metric is asset focused and is measured as follows:
High: Strong security controls like multifactor authentication, with data encryption implemented. Endpoints are postured.
Medium: Security control is limited to data access only and is implemented for certain users. Employees can access data with fewer security controls.
Low: Protection for critical data is limited. Encryption at rest is not implemented.
This metric aligns with the mission statement “Provide convenient and easy data access for customers and employees.”
Organizational agility measured quantitatively: Organizational agility is the capability of the enterprise to pivot to a different type of workload or strategy when performance and scale are critical. This specifically points to cloud movement and can be measured as a percentage of on-premises workload that has successfully moved to the cloud with the right security controls in place.
This metric aligns with the mission statement “Rapid expansion to a multicloud architecture.”
Total cost of ownership (TCO) measured quantitatively: TCO is a financial metric that measures the total cost of a technology investment over its entire lifecycle. In the context of cloud migration and Zero Trust adoption, TCO can be used to compare the cost of running applications and services in a traditional on-premises environment versus the cost of running them in the cloud. To measure TCO, companies can consider factors such as hardware and software costs, maintenance and support expenses, energy consumption, and personnel costs associated with managing the infrastructure. By quantifying these costs and comparing them to the cost of running the same applications and services in the cloud, companies can determine the potential cost savings of cloud migration. With the right Zero Trust strategy, movement to cloud is simpler and measured separately. Quantitative measures of TCO will include cost savings achieved through reduced hardware and software expenses, lower energy consumption, and more efficient use of IT staff. This metric can be tracked over time to measure the ongoing cost benefits of cloud migration and to identify opportunities for further optimization.
This metric aligns with the mission statement “Rapid expansion to a multicloud architecture.”
Tactical Performance Metrics
Reduce the existing blast radius by segmenting the network and applications measured quantitatively. Segmentation is a critical tactical goal when it comes to Zero Trust to reduce the blast radius of an attack. Segmentation needs to be achieved at the user, workload, and network architecture and traffic levels and can be tracked as a percentage of the total. Workload segmentation can be tracked as a percentage of the total workload, and network segmentation can be tracked as a percentage of the total network setup.
This metric aligns with the mission statement “Proactive approaches to managing breach risk.”
Achieve endpoint posturing to augment existing subject context measured quantitatively: Endpoint posturing refers to the security posture of an endpoint device, such as a computer or a mobile device, in a network environment. It involves the measures taken to secure the device and its data, including the installation of security software, the implementation of security policies, and the application of patches and updates. As a tactical metric, endpoint posturing can be measured by assessing the security posture of each endpoint device in a network. This assessment typically involves evaluating the endpoint's compliance with security policies, the presence of security software and updates, and the vulnerable threat surface exposed to attack vectors, and it will be expressed as a percentage of the entire device asset inventory of the enterprise.
This metric aligns with “Protect customers’ and employees’ data” as well as “Proactive approaches to manage breach risk.”
Reduce incident response time measured quantitatively: Incident response is important when it comes to Zero Trust, and a key metric to measure the incident response effectiveness is how soon an incident can be isolated, artifacts captured, and reports created. With a larger automation and orchestration (SOAR) initiative, the aim of this metric is to measure how fast the enterprise can isolate, identify, and take effective action either automatically or manually. This is measured in minutes, hours, or days, depending on the overall average.
This aligns with the mission statement “Proactive approach to breach risk.”
Operational Performance Metrics
Reduce troubleshooting time during incidents measured quantitatively: With simple contextual policies and simple design by Zero Trust, troubleshooting configuration and flow issues should be simpler. With more detailed visibility provided by Zero Trust initiatives, troubleshooting and root cause analysis must take less time, measured in hours or days.
This metric aligns with “Create simple and efficient application, network, and user architectures.”
Reduce mean time to detection of security incidents measured quantitatively: As an operational metric, this measures how fast the enterprise can detect anomalous incidents. This will include a combination of technology like user and endpoint behavior analysis (UEBA), behavior analytics, and other behavior-based solutions to provide accurate information to reduce detection time. The faster the solution can identify the type of flow, the faster it can detect whether it’s an anomaly and is measured in minutes, hours or days.
The metric aligns with “Proactive approach to managing breach risk” and “Simple application, user and network architecture.”
Successfully block fraudulent activities measured quantitatively: This metric measures how well the enterprise is able to detect and block fraudulent activities. With the right visibility controls, the metric is measured as a percentage of total activities recorded. The goal is to achieve 98% or above block rate.
A tactical visibility and automation initiative is needed to align with the “Protect customers and employee data” mission statement.
Reduce downtime of applications and services measured quantitatively: This metric will measure how much availability the application can provide, along with security controls in place. The goal will be achieved if the network provides 99.99% or more uptime.
This metric aligns with the “Provide convenient and easy access to data” as well as “Prioritize performance and scale.”
As demonstrated, all metrics align with your key mission statements and each metric gets mapped to tactical projects that need to be completed based on your feedback. With the overall cost of projects at hand, we can provide a security budget, but we would like to make sure your metrics are completely accurate. We have spent quite some time with Mariam and William and have understood pain points and what exactly you would like to measure based on your vision.
Mr. Smith: Honestly, I am not sure if we have ever aligned our metrics to our vision in such detail for other strategies. I am impressed. Sam, what do you think?
Ms. Lee: I think this is a good start for us to align. So, what exactly is our next step?
Glenn: Currently we have identified these key performance metrics that you can use to drive adoption for the Zero Trust ideas to other stakeholders. Here is how your tactical road map looks (see Figure 5-5).
)
Figure 5-5 Zenith Trust Bank’s Vision Tactical Enablers Based on Performance Metrics
Like I mentioned, based on your pain points and discussions with your infrastructure and security leads, we have also been able to run some key threat scenarios and have identified gaps in the infrastructure. With these gaps we have performed a maturity assessment, which has also helped us craft risk metrics and an implementation road map to help you showcase the true value of Zero Trust as a security framework for Zenith Trust Bank.
Mr. Chen: Gap analysis? What exactly have you been able to extract and what was your reference?
Glenn: We spent time discovering your network and identifying all the possible segments, assets and threat actors to produce a maturity assessment. The assessment is a reference for you as well as a baseline for us that helps create new metrics based on risk, which we added to your existing list of metrics. This will also reveal the additional security controls needed to reduce the risk in your infrastructure, which will eventually impact the overall security budget.
Mr. Smith: Alright, tell me more about this maturity assessment. Is it similar to the audit we had done?
Glenn: It is not, but there is some scope that overlap. Let me explain in detail.